XRP Price Prediction for Today, November 29 – XRP Technical Analysis
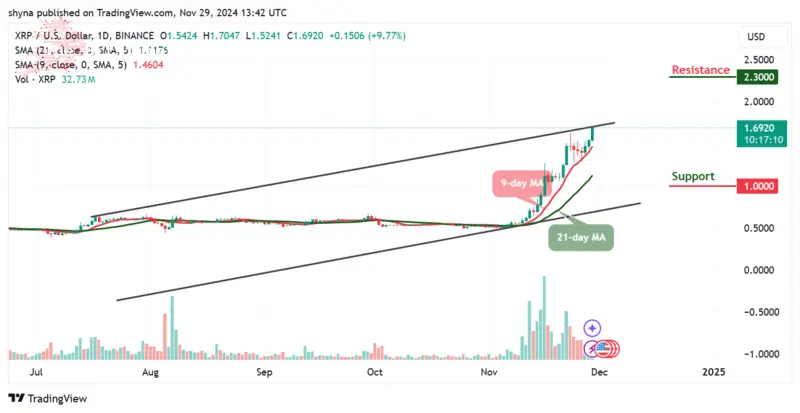
The XRP price prediction shows that XRP is attempting to cross above the upper boundary of the channel to increase the bullish movement.
XRP Prediction Statistics Data:
- XRP price now – $1.69
- XRP market cap – $92.23 billion
- XRP circulating supply – 57.05 billion
- XRP total supply – 99.9 billion
- XRP Coinmarketcap ranking – #5
Getting in early on crypto projects can yield remarkable returns, as demonstrated by XRP’s incredible journey. Currently trading between $1.43 and $1.69 in the past 24 hours, XRP remains about 56.02% below its all-time high of $3.84 from January 4, 2018. However, its rise from an all-time low of $0.04664 on July 4, 2014, to today’s levels represents a staggering +60,194.13% increase. This phenomenal growth showcases the potential of early adoption in the crypto space and the opportunities blockchain technology offers to forward-thinking investors.
XRP/USD Market
Key Levels:
Resistance levels: $2.30, $2.40, $2.50
Support levels: $1.00, $0.90, $0.80

XRP/USD is currently showing a bullish reversal on the daily chart, largely fueled by favorable market news, particularly regarding the ongoing legal situation between Ripple and the SEC. XRP/USD has now returned to its previous highs, forming a familiar pattern of a top, followed by a short downtrend, a consolidation phase, and then a renewed uptrend. Such a structure is often a precursor to further upside, as price action tends to continue higher after retesting the previous peak. The breakout above $1.52 suggests that XRP could continue to push toward the next major resistance zone between $1.70 and $1.75.
XRP Price Prediction: XRP Likely to Hit $1.75 High
At the time of writing, XRP may continue to trend to the upside as the bullish movement above the upper boundary of the channel could push the coin to the resistance levels of 2.30, $2.40, and $2.50. On the downside, a bearish movement below the 9-day and 21-day moving averages could stop the initial upward movement and create bearish momentum with the focus on bringing the market to the next support levels at $1.00, $0.90, and $0.80 respectively.
Looking at the technical indicators on the daily chart, the trend remains positive. XRP has seen a steady increase in momentum, which has carried the price above key resistance levels. While some traders took profits after the initial breakout, the overall market structure suggests that XRP could continue to gain ground. A pullback at this stage is possible, but it would likely be short-lived if the price remains above critical support levels. If a bullish flag or consolidation pattern forms in the near term, it could provide another opportunity for traders to enter the market for a move toward higher resistance levels.
XRP/BTC Spikes to the Upside
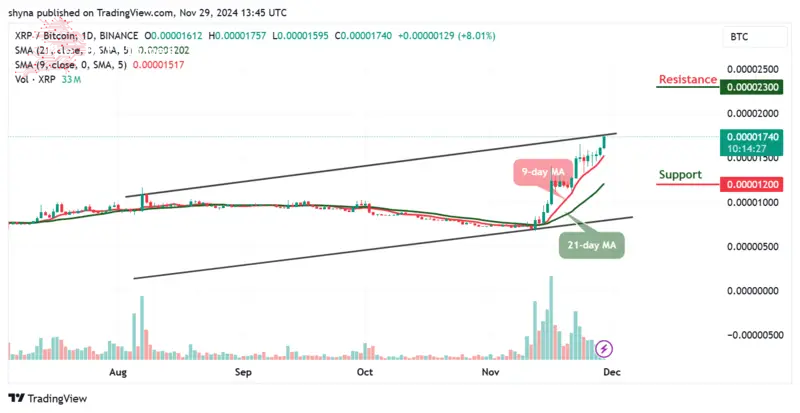
On the XRP/BTC chart, the breakout above a significant resistance level, such as 1757 SAT, signals a potential trend reversal. This level, previously a psychological barrier, has been surpassed with increased trading volume, indicating strong buying pressure against Bitcoin. The structure of the price movement — an initial peak, a pullback into consolidation, and a breakout into a higher high — suggests further upward potential.

Meanwhile, if the bears break below the moving averages, the market price could reach the support level at 1200 SAT and below. Nevertheless, any further bullish movement could allow the coin to go above the upper boundary of the channel to hit the resistance level of 2300 SAT and above as the technical indicator 9-day moving average keeps hovering above the 21-day moving average.
However, MikybullCrypto, a prominent analyst with over 79k followers on X (formerly Twitter), suggests that XRP may replicate its 2017 rally pattern. He predicts an initial surge to $2, followed by a pullback, and then a continuation of its upward trajectory, potentially reaching a new cycle peak around $10.
$XRP 2017 kind of rally vibes.
Hit $2, experience a pullback, and then continue its vertical hated rallies to a new cycle top of probably $10. pic.twitter.com/gXGIUsy9Rj
— Mikybull 🐂Crypto (@MikybullCrypto) November 29, 2024
XRP Alternatives
The daily chart of XRP/USD suggests a solid uptrend with strong potential for further gains. The breakout above $1.70 and the confirmation of momentum indicate that the market is positioned for a continuation toward higher resistance levels. The next target for XRP is between $1.75 and $1.80, and if the price can surpass these levels, the road to $1.95 and possibly $2.00 will be open. However, Pepe Unchained has garnered significant attention within the cryptocurrency market, particularly in the meme coin sector. Early inflows exceeding $57 million, with an average of nearly $100,000 per hour, indicate a strong initial interest in the presale phase.
The Next Big Meme Coin! Pepe Unchained Has 10x Potential
This project is already breaking records and building momentum. Positioned at the cusp of a potential crypto bull market, and with interest in meme coins surging, Pepe Unchained offers a unique opportunity to capitalize on this explosive trend. Don’t miss your chance to join this rapidly growing movement — secure your stake in what could be the next big meme coin.
Visit Pepe Unchained
Related News
- Is It Too Late To Buy XRP? XRP Price Soars 7% As Paul Atkins Emerges As Favorite For SEC Chair
- After Recent Dip, New Meme Coin Pepe Unchained’s Unstoppable Presale Powers Ahead
Comments
Post a Comment